
Friday, November 28, 2003
Posted by Johnnymac 10:44 AM
Poker and Statistics - Like Beer and Pizza!
Like Dr Fro, I have also been keeping records of my poker results. I got lazy for a while and didn't keep track of anything for more than a year, but I started up again in July and I'm beginning to accumulate enough data to start making observations. I've made some graphs that are quite interesting (click on the graphs to open larger versions).
First off - I'm taking time out from tournaments, too.
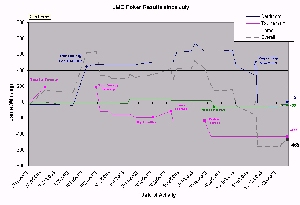
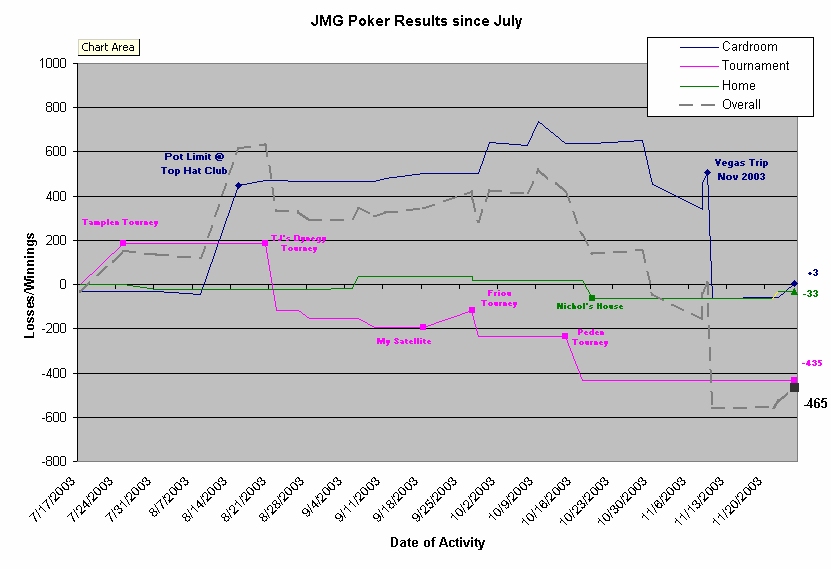
The first thing you'll see from this graph is that I'm down $465 since July. The next thing you'll notice is my bad day in Vegas earlier this month (more on that below), and the third thing you will see is probably that $435 of my total losses is from playing in big tournaments with large buyins ($100+) and forty or more players. While the poker "revolution" has been great both for the attention that the game is getting and the increase in action from bad players, a lot of newer players are naturally drawn to wanting to repeat what they see on television and thus are wanting to play in tournaments. Granted, as I have extolled in this space many times before, these tournaments can be very lucrative opportunities against (usually) poor competition, but the tournament structure itself limits the extent to which that poor competition can be exploited. Tournaments require one to be lucky (or at least to avoid being un-lucky) for a long period of time before any positive return can be realized, while it only takes one big hand for a cash game to become profitable.
Another way to look at this: Even if my skill and experience were to increase my chances in a 50 player tourment by a factor of 10, that would still just improve my chances from 1 in 50 (pure luck) to 1 in 20 - only 5%! Assuming that the entry fee in every tournament I play is $100 (which is on the low side), that means I could end up dropping $2000 (or likely more) in entry fees before I could expect to start seeing the benefits of this "lucrative" opportunity. Granted, this reasoning is slightly simplistic because I could at least finish "in the money" in a couple of tournaments and at least get some money back, but that money still probably wouldn't be enough to cover my losses in all of the other tournaments where I win nothing.
So if tournaments are bad bets for me and I'm so sure that I have a positive expectation from just grinding away in cash games, then just exactly how much should I expect to win in a cash game? That's the next graph:
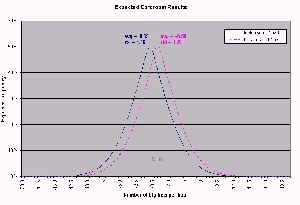
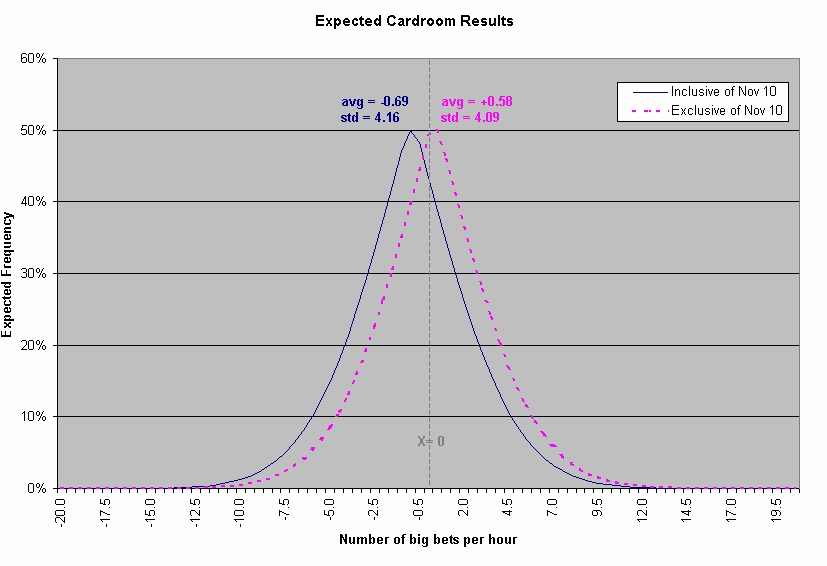
This is a graph of a normalized distribution of my hourly results in cardroom (casino style) games since July. There are 56 hours of data there. If you're not familiar with a normal distribution, it can best be explained as a chart that shows the the forecasted results of a series of trials (events) on the x-axis, and on the y-axis, the percentage of trials that achieve each particular result. In this case, the chart is showing my expected results in big bets won or lost for each hour of poker played. For example, if you look at the dashed pink line, I should expect to win just over 4.5 big bets per hour 20% of the time I am playing cards in a cardroom. This chart was created by taking a weighted average of the results of my hours of play and then finding a standard deviation per hour, then applying those two pieces of data to a normal distribution (this is Freshman Statistics 101 - just trust me if you don't understand it).
There are actually two distributions on this graph because of those 56 hours, 3.5 were played in a daytime mid-limit game in Las Vegas (Bellagio 8/16). I lost 10 big bets an hour and slightly went on tilt enough to where I think that time was indicative neither of my normal game nl results - the players were much better, the stakes were higher, and the game was much tougher than my usual 3/6/12 action at the FSC. For all of these reasons, I debated whether to include these hours at all and compromised by making two curves - one that includes these hours and one that doesn't. Quite clearly, those 3.5 hours had a significant effect on my analysis because dropping them out increased my average result by almost one full bet (and from positive to negative) and it reduced my standard deviation (the variability of results and "spread" of the curve), too.
So what does this graph tell me? For one thing, it says that, at least based on the 53 hours I have played since July, I have a positive expectation per hour of slightly more than half a big bet, and, for all of you stats literate readers, 95% of the time I should expect my results to be within a range of -7.7 and +8.8 bets per hour. This is still a fairly large spread and my mean earnings number is still less than the 1 big bet per hour that all of the expert writers claim should be the goal of most players. I will continue to update this analysis as I keep playing - I would expect that my mean results will slowly increase and the standard deviation will slowly decrease. More later.
0 Comment(s):
Random thoughts from a lawyer, an accountant, a commodities trader, an ex-Marine and a WSOP Main Event money finisher that don't know as much as they wish they did...
Email What's this all about? Poker. Why we like poker. What we have to say about poker. How we play poker.
current

Johnnymac-at-itaintgambling.com

Why isn't it gambling?
ARCHIVE:
09/01/2003 - 10/01/2003
10/01/2003 - 11/01/2003
11/01/2003 - 12/01/2003
12/01/2003 - 01/01/2004
01/01/2004 - 02/01/2004
02/01/2004 - 03/01/2004
03/01/2004 - 04/01/2004
04/01/2004 - 05/01/2004
05/01/2004 - 06/01/2004
06/01/2004 - 07/01/2004
07/01/2004 - 08/01/2004
08/01/2004 - 09/01/2004
09/01/2004 - 10/01/2004
10/01/2004 - 11/01/2004
11/01/2004 - 12/01/2004
12/01/2004 - 01/01/2005
01/01/2005 - 02/01/2005
02/01/2005 - 03/01/2005
03/01/2005 - 04/01/2005
04/01/2005 - 05/01/2005
05/01/2005 - 06/01/2005
06/01/2005 - 07/01/2005
07/01/2005 - 08/01/2005
08/01/2005 - 09/01/2005
09/01/2005 - 10/01/2005
10/01/2005 - 11/01/2005
11/01/2005 - 12/01/2005
12/01/2005 - 01/01/2006
01/01/2006 - 02/01/2006
02/01/2006 - 03/01/2006
03/01/2006 - 04/01/2006
04/01/2006 - 05/01/2006
05/01/2006 - 06/01/2006
06/01/2006 - 07/01/2006
07/01/2006 - 08/01/2006
08/01/2006 - 09/01/2006
09/01/2006 - 10/01/2006
10/01/2006 - 11/01/2006
11/01/2006 - 12/01/2006
12/01/2006 - 01/01/2007
01/01/2007 - 02/01/2007
02/01/2007 - 03/01/2007
03/01/2007 - 04/01/2007
04/01/2007 - 05/01/2007
05/01/2007 - 06/01/2007
06/01/2007 - 07/01/2007
07/01/2007 - 08/01/2007
08/01/2007 - 09/01/2007
09/01/2007 - 10/01/2007
10/01/2007 - 11/01/2007
11/01/2007 - 12/01/2007
12/01/2007 - 01/01/2008
01/01/2008 - 02/01/2008
02/01/2008 - 03/01/2008
03/01/2008 - 04/01/2008
04/01/2008 - 05/01/2008
05/01/2008 - 06/01/2008
06/01/2008 - 07/01/2008
07/01/2008 - 08/01/2008
08/01/2008 - 09/01/2008
09/01/2008 - 10/01/2008
10/01/2008 - 11/01/2008
11/01/2008 - 12/01/2008
12/01/2008 - 01/01/2009
01/01/2009 - 02/01/2009
02/01/2009 - 03/01/2009
03/01/2009 - 04/01/2009

aka "slow roller"
aka "Sunday Stroller"
aka "Chop Suey"
aka "Mo roller"
"Baby's Daddy"

I play poker at Poker.com